
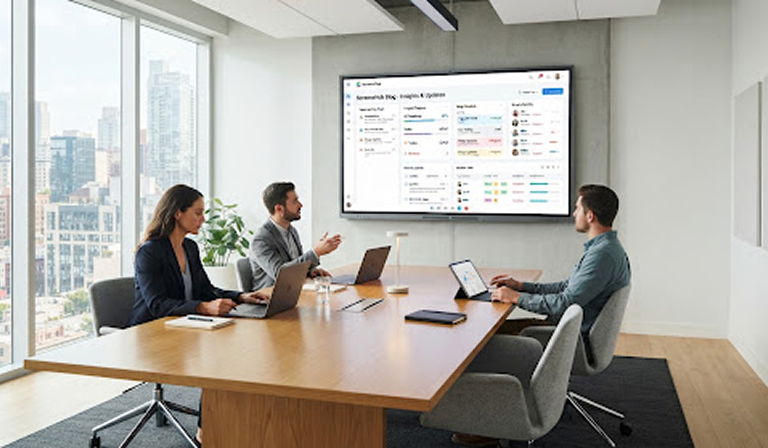
Digital signage has evolved from simply displaying content to becoming a measurable, data-driven communication channel. As businesses deploy more screens across different locations, understanding what is happening across a digital signage network has become just as important as managing the content itself.
That is why V3.0 introduces a new generation of real-time analytics, giving businesses greater visibility into their digital signage performance, device health, content delivery, and audience engagement.
The new Real-Time Analytics Dashboard is designed to turn complex signage data into actionable insights. Instead of relying on disconnected reports or manually checking individual devices, teams can access critical information from one centralized dashboard.
What Is the V3.0 Real-Time Analytics Dashboard?
The V3.0 Real-Time Analytics Dashboard is a centralized analytics environment that helps businesses monitor their digital signage network and understand its performance.
From a single interface, teams can gain visibility into key metrics such as:
- Connected and offline displays
- Content playback
- Screen activity
- Campaign performance
- Device status
- Location-based performance
- Engagement metrics
- System alerts
- Historical trends
The goal is simple: make digital signage data easier to understand and act on.
Rather than presenting businesses with large amounts of raw information, V3.0 organizes important metrics into a clear and accessible interface.
Why Real-Time Analytics Matter for Digital Signage
Traditional digital signage management often focuses on whether content was successfully uploaded to a screen.
But modern signage networks require a much broader perspective.
Businesses need to know:
Is the screen online?
Is the content playing correctly?
Which locations are performing best?
Are campaigns reaching their intended audience?
Are there devices that require attention?
Real-time analytics can help answer these questions without requiring teams to manually inspect every display.
This is particularly important for organizations managing large networks across multiple stores, offices, campuses, cities, or countries.
A Centralized View of Your Entire Network
One of the key advantages of V3.0 is centralized visibility.
Instead of switching between different systems or manually collecting information from individual devices, users can access network-level information from one dashboard.
This provides a high-level overview while still allowing teams to drill down into specific locations, devices, campaigns, or content.
For example, a marketing manager may want to see campaign performance across the entire organization, while an IT administrator may need to identify displays that are offline.
The same dashboard can support both use cases.
Real-Time Device Monitoring
Digital signage depends on reliable hardware and connectivity.
A display that is offline or experiencing technical problems can affect communication, advertising campaigns, and customer experiences.
V3.0 analytics can make device monitoring more efficient by providing visibility into the status of connected screens.
Teams can quickly identify:
- Online devices
- Offline devices
- Connectivity issues
- Playback problems
- Device activity
- System alerts
This can reduce the time required to identify technical problems and help teams respond before they become larger operational issues.
Understanding Content Performance
Knowing what content is being displayed is only part of the equation.
Businesses also need to understand how their content performs.
The V3.0 dashboard can help organizations analyze content-related metrics and identify patterns across campaigns and locations.
For example, a business may discover that one promotional campaign performs significantly better in certain locations than another.
These insights can help marketing teams make more informed decisions about future campaigns.
Instead of relying entirely on assumptions, businesses can use data to guide their digital signage strategy.
Location-Based Analytics
Businesses operating multiple locations often need to understand how different sites are performing.
V3.0 can make location-level analysis easier by organizing analytics around individual stores, offices, branches, or other deployment areas.
Teams can compare locations and identify differences in:
- Screen availability
- Content playback
- Campaign performance
- Engagement
- Device health
- Network activity
This can reveal opportunities that might otherwise remain hidden within organization-wide data.
For example, a retailer could identify locations where a particular campaign generates stronger engagement and investigate what makes those locations different.
Turning Data Into Actionable Insights
A dashboard is only valuable if the information it provides can support better decisions.
V3.0 is designed around the principle of turning data into actionable insights.
Instead of simply showing numbers, analytics can help answer practical questions such as:
- What is working?
- What is not working?
- Where is performance improving?
- Which locations need attention?
- Which campaigns deserve more investment?
- Which devices require maintenance?
This changes analytics from a reporting function into a decision-making tool.
Easier Performance Tracking
Without centralized analytics, teams may need to collect information manually from different systems.
This process can be time-consuming and may introduce inconsistencies.
A centralized dashboard makes performance tracking easier by bringing important information into one place.
Users can monitor trends over time and compare current performance with historical results.
This makes it easier to identify changes and determine whether a campaign or operational improvement is having the desired impact.
Better Reporting for Marketing Teams
Marketing teams can use analytics to evaluate digital signage campaigns more effectively.
Instead of simply reporting that a campaign was displayed, teams can investigate its performance across different environments.
Useful insights may include:
- Campaign reach
- Playback activity
- Location performance
- Engagement trends
- Content comparisons
- Campaign duration
- Performance changes over time
These insights can contribute to better campaign planning and resource allocation.
Supporting IT and Operations Teams
The V3.0 dashboard is not only useful for marketing.
IT and operations teams can benefit from centralized device visibility and system monitoring.
A large signage network can contain hundreds or thousands of endpoints. Manually checking every device is inefficient.
Analytics can help technical teams quickly identify potential issues and prioritize maintenance.
For example, if several displays in one location suddenly go offline, the team can investigate the location’s network or hardware infrastructure instead of checking every screen individually.
Faster Troubleshooting
Real-time visibility can significantly improve troubleshooting workflows.
When an issue occurs, teams need information about what happened and where it happened.
A centralized analytics dashboard can provide useful context, helping teams move from:
Problem → Detection → Investigation → Resolution
more efficiently.
This can reduce downtime and improve the reliability of digital signage networks.
Data Visualization That Makes Sense
Large amounts of data can become difficult to understand if they are presented without structure.
V3.0 focuses on making analytics easier to interpret through organized dashboards and visual reporting.
Charts, graphs, status indicators, and performance summaries can help users understand trends at a glance.
For busy teams, this is important.
A dashboard should not require users to spend hours analyzing spreadsheets before they can identify an important issue.
The right visualization can make a complex dataset much easier to understand.
Real-Time Alerts and Notifications
Another important component of modern analytics is proactive monitoring.
Instead of waiting for someone to discover a problem manually, a connected signage platform can identify certain conditions and generate alerts.
Examples may include:
- Display offline
- Connectivity failure
- Playback interruption
- Device health issue
- Unexpected system behavior
- Campaign delivery problem
This allows teams to respond more quickly.
The objective is to move from reactive monitoring toward proactive network management.
Making Better Business Decisions
Analytics can influence decisions beyond day-to-day signage management.
Businesses can use digital signage data to evaluate:
- Where additional displays may be useful
- Which campaigns should be repeated
- Which locations perform best
- Where technical investment is needed
- Which content deserves greater visibility
- How signage contributes to customer engagement
Over time, this can help organizations build a more strategic approach to digital signage.
Scalability for Growing Networks
A major challenge for businesses is maintaining visibility as their signage network grows.
Managing ten screens is very different from managing 1,000.
As the number of devices increases, centralized analytics becomes increasingly valuable.
V3.0 provides a foundation for organizations to scale their digital signage operations while maintaining visibility across the network.
Whether a business operates a small collection of displays or a large multi-location network, analytics can provide a consistent way to monitor performance.
From Data to Digital Signage Intelligence
The introduction of V3.0 represents a broader shift in the digital signage industry.
Modern digital signage platforms are becoming more intelligent.
The screen itself is only one part of the system. Behind every display is a combination of:
- Hardware
- Software
- Connectivity
- Content
- Data
- Analytics
- Automation
When these components work together, digital signage becomes a measurable digital communication platform rather than simply a display.
What Makes V3.0 Different?
The key difference is the emphasis on real-time visibility and actionable data.
V3.0 brings together network monitoring, content insights, device information, and performance analytics into a centralized experience.
This gives different teams the information they need without requiring them to work with disconnected systems.
For businesses, this means greater visibility.
For marketing teams, it means better campaign insights.
For IT teams, it means faster issue detection.
For management, it means clearer performance information.
The Future of Digital Signage Analytics
As digital signage networks become more connected, analytics will become increasingly important.
Future platforms are likely to incorporate more advanced capabilities such as artificial intelligence, predictive analytics, automated recommendations, and deeper audience insights.
Instead of simply reporting what happened, analytics platforms may increasingly help organizations understand why it happened and what they should do next.
This could make digital signage management more automated, intelligent, and efficient.
Conclusion
The launch of V3.0 Real-Time Analytics Dashboard represents an important step toward smarter digital signage management.
By bringing network visibility, device monitoring, content performance, location-based insights, and operational analytics into one centralized dashboard, V3.0 helps businesses better understand their digital signage ecosystem.
The value of digital signage is no longer limited to what appears on the screen. The data behind those screens can provide valuable insights into performance, reliability, engagement, and business opportunities.
With real-time analytics, organizations can move from simply managing displays to managing a measurable digital communication network.
And as digital signage continues to evolve, that shift from screens to intelligent, data-driven experiences will become increasingly important.
Frequently Asked Questions
What is a real-time digital signage analytics dashboard?
A real-time digital signage analytics dashboard is a centralized interface that provides current information about digital signage devices, content, campaigns, performance, and network activity.
Why are analytics important for digital signage?
Analytics help businesses understand how their signage network is performing. They can identify technical problems, compare locations, evaluate campaigns, and make more informed decisions.
Can analytics help identify offline displays?
Yes. Connected digital signage platforms can monitor device status and help identify displays that are offline or experiencing connectivity issues.
Who can benefit from the V3.0 analytics dashboard?
Marketing, IT, operations, sales, and management teams can all benefit from digital signage analytics, although the specific insights they need may differ.
Can digital signage analytics improve campaigns?
Yes. Performance data can help businesses understand which content and campaigns perform better across different locations and audiences, supporting more informed campaign decisions.
Is real-time analytics useful for large digital signage networks?
Absolutely. The larger the network, the more difficult manual monitoring becomes. Centralized real-time analytics can provide visibility across many devices and locations from one platform.
What is the future of digital signage analytics?
The future is likely to include more AI-powered insights, predictive analytics, automated recommendations, deeper personalization, and increasingly proactive monitoring.